Bokeh小册子:入门
阅读量:次 Authors: 阳哥 PYTHONVISUALIZATION
Bokeh
阅读量:次 Authors: 阳哥 PYTHONVISUALIZATION
Bokeh
Table of Contents
一直觉得 Bokeh 的图很漂亮,今天我们来开始用 bokeh 制图, 本文是开篇,希望大家喜欢~
本次运行环境为:
bokeh 中绘图有两类主要的接口, bokeh.plotting 和 bokeh.models , 其中 plotting 是高级接口,一般情况下我们使用 bokeh,plotting 较多。 下面,我们介绍的内容,主要是针对 bokeh.plotting
在bokeh中绘制图表的常规步骤:
首先,在绘制图表框架 figure() 时,可以设置图表大小(plot_wihth,plot_height),也可以设置图表框架旁边所用的工具(tools)
工具可以是以下 value,可以根据实际情况来选择合作的工具使用。
“crosshair,pan,wheel_zoom,box_zoom,reset,box_select,lasso_select,save”
from bokeh.plotting import output_notebook, figure, show
import pandas as pd
import numpy as np
output_notebook()
# tools="pan,box_zoom,wheel_zoom,reset,save"
# 工具可以是以下 value,可以根据实际情况来选择合作的工具使用
tools = "crosshair,pan,wheel_zoom,box_zoom,reset,box_select,lasso_select,save"
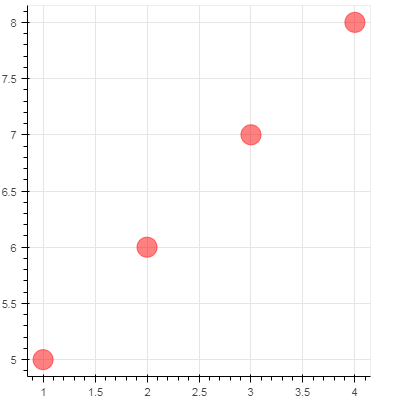
p = figure(plot_width=400, plot_height = 400, tools=tools)
p.circle([1,2,3,4],[5,6,7,8],size=20, color='red', alpha=0.5)
show(p)
其中,参数:alpha,数值越小,透明度越高
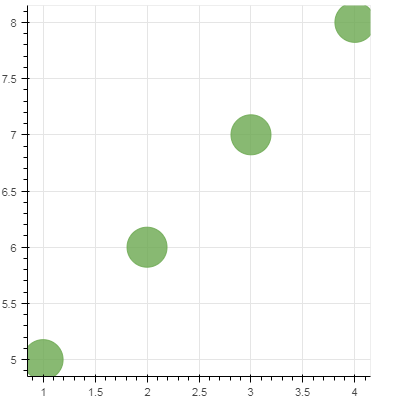
参数 angle,对于 circle 而言,angle参数似乎没有用……(因为本身就是圆的,旋转角度没有影响)
p = figure(plot_width=400, plot_height = 400)

p.circle([1,2,3,4],[5,6,7,8],size=40, color='#6aa84f', alpha=0.8, angle=0.8)

show(p)
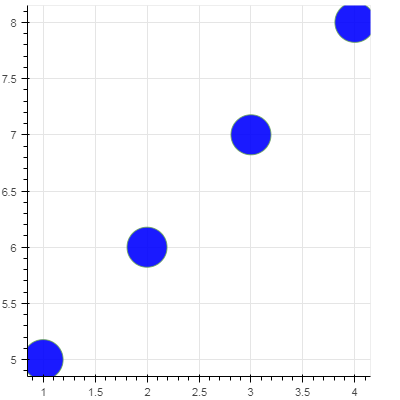
fill_color, fill_alpha, 这两个参数用来设置圆体的填充颜色和透明度
p = figure(plot_width=400, plot_height = 400)

p.circle([1,2,3,4],[5,6,7,8],size=40, color='#6aa84f', alpha=0.8,
         angle=0.8,fill_alpha=0.9, fill_color='blue')

show(p)
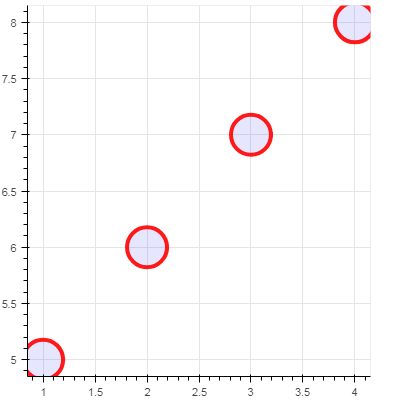
p = figure(plot_width=400, plot_height = 400)

p.circle([1,2,3,4],[5,6,7,8],size=40, color='#6aa84f', alpha=0.8,
         angle=0.8,fill_alpha=0.1, fill_color='blue',
        line_color='red', line_alpha=0.9, line_width=4,
        line_cap='square')

# LineCap = Enumeration(butt, round, square)
# Specify how stroked lines should be terminated

show(p)
line_dash
官方描述如下 Accept line dash specifications.
Express patterns that describe line dashes. DashPattern values can be specified in a variety of ways:
An enum: “solid”, “dashed”, “dotted”, “dotdash”, “dashdot” a tuple or list of integers in the HTML5 Canvas dash specification style. Note that if the list of integers has an odd number of elements, then it is duplicated, and that duplicated list becomes the new dash list. To indicate that dashing is turned off (solid lines), specify the empty list [].
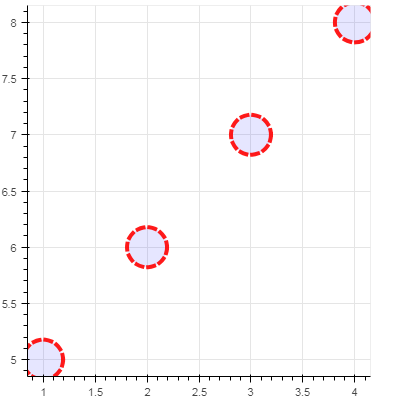
p = figure(plot_width=400, plot_height = 400)

p.circle([1,2,3,4],[5,6,7,8],size=40, color='#6aa84f', alpha=0.8,
         angle=0.8,fill_alpha=0.1, fill_color='blue',
        line_color='red', line_alpha=0.9, line_width=4,
        line_cap='square', line_dash='dashed')

show(p)
当然, circle() 中还有其他的参数可以设置,有兴趣的童鞋不妨自行摸索下。
对我的文章感兴趣的朋友,可以关注我的微信公众号「Python数据之道」(ID:PyDataLab),接收我的更新通知。