Bokeh中图形与组件的布局简介
阅读量:次 Authors: 阳哥 PYTHONVISUALIZATION
Bokeh
阅读量:次 Authors: 阳哥 PYTHONVISUALIZATION
Bokeh
图形(plot)的布局可以通过 column() 、 row() 和 gridplot() 方法来实现,其中:
1、 column() 方法是将所有图形(plots)在一列中分布;
2、 row() 方法是将所有图形(plots)在一行中分布;
3、 gridplot() 方法,可以按需求进行行列分布。
把所有图形放在一列中分布,其基本用法为 column([plot_1, plot_2, ……, plot_n])
from bokeh.io import output_notebook, show
from bokeh.layouts import column, row, gridplot
from bokeh.plotting import figure
import numpy as np

output_notebook()
准备基础数据和图形
np.random.seed(15)

x=np.random.randint(1,20,size=6)
y=np.random.randint(20,50,size=6)

p1 = figure(title='circle',plot_width=300,plot_height=300)
p1.circle(x,y,size=20, color='#0071c1')

p2 = figure(title='circle_cross',plot_width=300,plot_height=300)
p2.circle_cross(x,y,size=20, color='#0071c1',fill_alpha=0.2, line_width=2)

p3 = figure(title='circle_x',plot_width=300,plot_height=300)
p3.circle_x(x,y,size=20, color='#0071c1',fill_alpha=0.2, line_width=2)

p4 = figure(title='cross',plot_width=300,plot_height=300)
p4.cross(x,y,size=20, color='#0071c1', line_width=2)
将图形按列进行布局
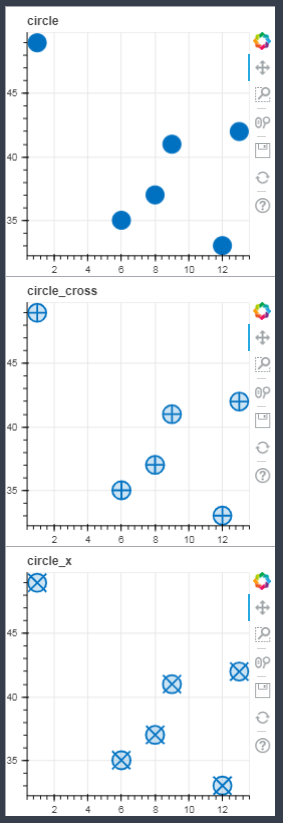
column_layout = column([p1, p2, p3])
show(column_layout)
如图1所示:
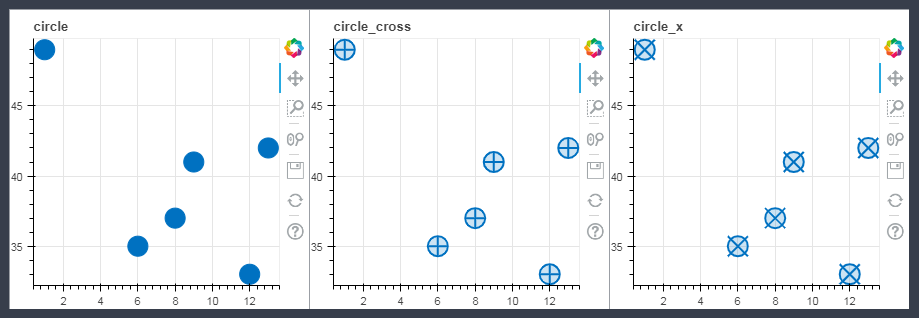
把所有图形按行分布,其基本用法为 row([plot_1, plot_2, ……, plot_n])
row_layout = row(p1,p2,p3)
show(row_layout)
如图2所示:
使用 gridplot 来进行个性化布局, gridplot 的参数如下:
gridplot(*args, **kwargs)
Create a grid of plots rendered on separate canvases. gridplot builds a single toolbar for all the plots in the grid. gridplot is designed to layout a set of plots. For general grid layout, use the layout() function.
Parameters:
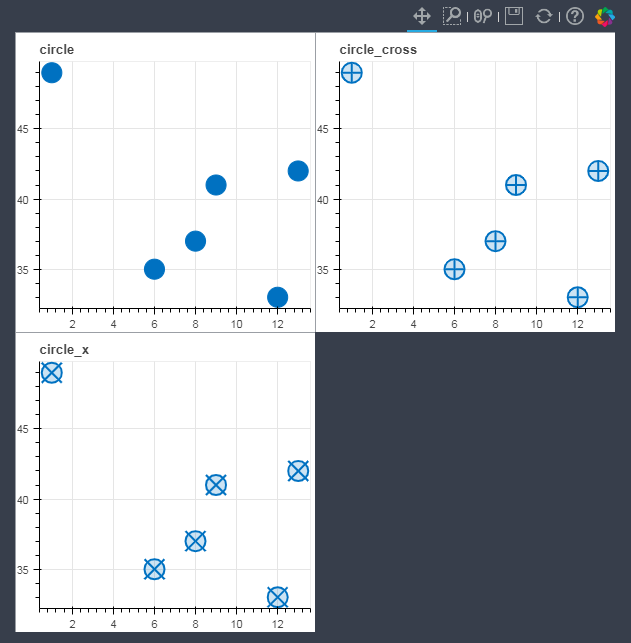
可以在 gridplot() 方法中,以列表的形式将 plots 分组按行列的形式表示出来,如果要预留一个空置的位置,可以用 “None” 来表示。
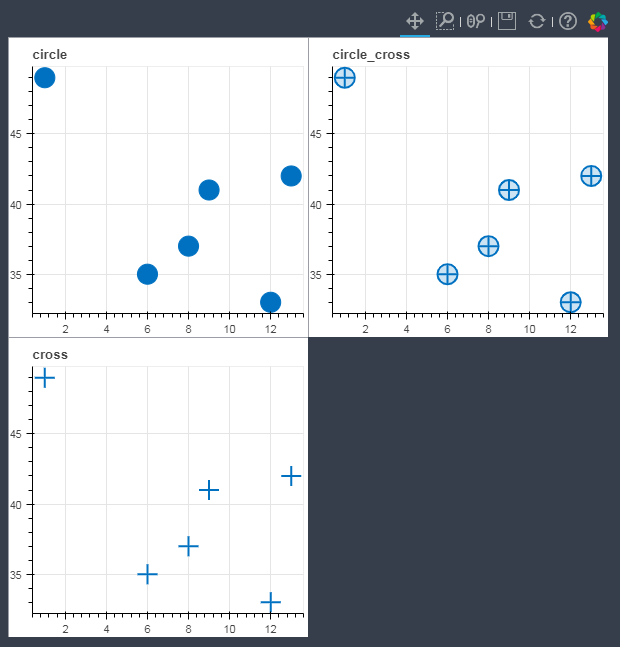
grid1=gridplot([p1,p2],[p3,])

show(grid1)
如图3所示:
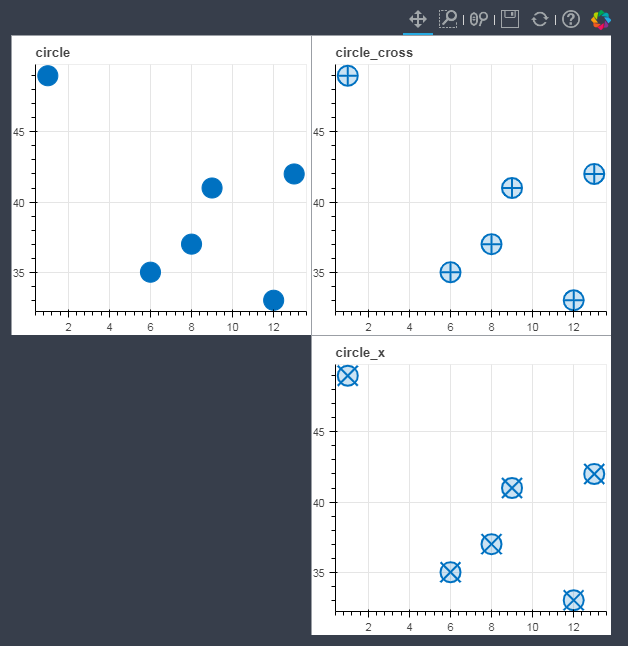
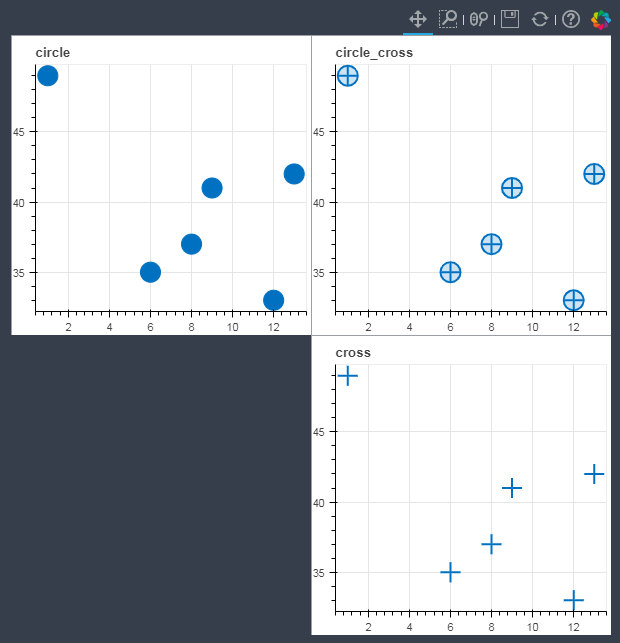
grid2=gridplot([p1,p2],[None,p3])

show(grid2)
如图4所示:
在 gridplot() 方法中,还可以引入参数 ncols 来控制显示的列数,这里所有的 plots 放在一个列表中即可。
P.S. 官方文档中,提到有 “ncols” 参数时,不能同时使用 “None”,但我尝试了一下,是可以同时使用 “None” 的。 有兴趣的小伙伴也可以试试。
官方的原文如下:
You cannot use None with the ncols argument. It must only be a list of Plot objects at once.
grid3=gridplot([p1,p2,p4],ncols=2, plot_width=300,plot_height=300)

show(grid3)
如图5所示:
grid4=gridplot([p1,p2,None,p4],ncols=2, plot_width=300,plot_height=300)

show(grid4)
如图6所示:
bokeh 中,组件(widgets)包括 按钮(button),选项(Group),滑动块(slider)等等;组件的布局通过 widgerbox() 方法来实现
from bokeh.layouts import widgetbox
from bokeh.models.widgets import Button, RadioButtonGroup, Select, Slider
from bokeh.models.widgets import Dropdown, Toggle

# 创建一些组件
slider = Slider(start=0, end=20, value=1, step=0.5, title="Slider")
button_group = RadioButtonGroup(labels=["Option 1", "Option 2", "Option 3"], active=0)
select = Select(title="Option:", value="Lemon", options=["Lemon", "Python", "Java", "PHP"])
button_1 = Button(label="Button 1")
button_2 = Button(label="Button 2")

menu = [("Item 1", "item_1"), ("Item 2", "item_2"), None, ("Item 3", "item_3")]
dropdown = Dropdown(label="Dropdown button", button_type="warning", menu=menu)

# put the results in a row
show(widgetbox(button_1, slider,
               button_group, select,
               button_2, dropdown, width=300))
如图7所示:
关于组件的具体内容介绍,我们会在后续进一步学习。
通过 layout() 方法,可以实现 图形(plots) 和组件(widgets)的混合布局。
from bokeh.layouts import layout

layout_01 =layout([slider],[p1,p2])

show(layout_01)
如图8所示:
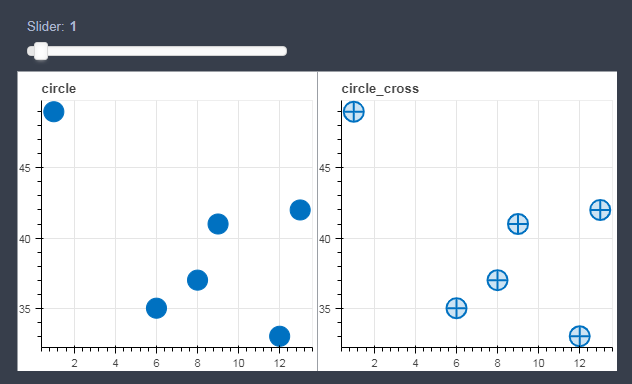
这里需要注意的是, slider 和 plot 是放置在一起,但它们之间是没有内在联系的。
对比 Python 中常用的可视化库 Matplotlib, 在 Bokeh 中,对图形和组件进行布局还是比较方便的。布局的功能,会在以后的实践中经常进行使用。
对我的文章感兴趣的朋友,可以关注我的微信公众号「Python数据之道」(ID:PyDataLab),接收我的更新通知。