Bokeh中独特的数据类型简介: ColumnDataSource
阅读量:次 Authors: 阳哥 PYTHONVISUALIZATION
Bokeh
阅读量:次 Authors: 阳哥 PYTHONVISUALIZATION
Bokeh
Table of Contents
本文的环境为
数据是进行数据可视化的必要基础, 在 bokeh 中,数据有几种呈现方式。
(1)直接提供数据
(2)通过 ColumnDataSource 来提供数据
首先加载相关Python库。
from bokeh.plotting import figure, output_notebook, show
from bokeh.layouts import gridplot
from bokeh.models import ColumnDataSource
import numpy as np
import pandas as pd

output_notebook()
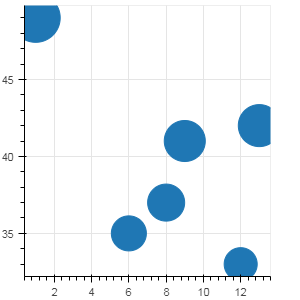
可以通过数据列的形式(list)直接提供数据
np.random.seed(15)

x=np.random.randint(1,20,size=6)
y=np.random.randint(20,50,size=6)

print(x)
print(y)

p = figure(plot_width=300, plot_height=300)
p.circle(x, y,size=y)

show(p)
[ 9 13  6  1  8 12]
[41 42 35 49 37 33]
图示如下:
ColumnDataSource 是 Bokeh 中一种重要的数据形式,ColumnDataSource() 方法有一个参数为 “data”, “data”主要有以下三种类型:
(1)data 为字典
(2)data 为 Pandas 的 DataFrame
(3)data 为 Pandas 的 DataFrame 的 groupby 对象
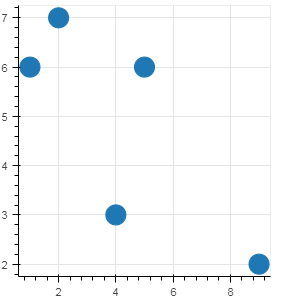
data 的表现形式是一个字典的形式, 一般情况下, 字典的 key 值是一个字符串,代表列名称, 而 value则是 list形式 或者 numpy的 array 形式。 演示如下:
data = {'x_values': [1, 2, 9, 4, 5],
        'y_values': [6, 7, 2, 3, 6]}

source = ColumnDataSource(data=data)
source
type(source)
bokeh.models.sources.ColumnDataSource
从上面结果来看, source 是一个 ColumnDataSource 对象,不能直接打印出来,后续可以在绘图是传入参数进行使用。
data = {'x_values': [1, 2, 9, 4, 5],
        'y_values': [6, 7, 2, 3, 6]}

source = ColumnDataSource(data=data)

p = figure(plot_width=300, plot_height=300)
p.circle(x='x_values', y='y_values', source=source, size=20)
show(p)
图示如下:
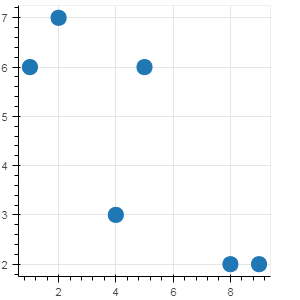
ColumnDataSource (简称为 CDS) 的 data 参数,也可以是 pandas 的 DataFrame。 当CDS的参数是 DataFrame 时,参数中可以直接用 DataFrame 的列名称,索引名称,也可以直接用DataFrame 已有的名称, 如果没有索引名称,默认情况下, 索引名称 用 “index” 就可以。
data = {'x_column': [1, 2, 9, 4, 5, 8],
        'y_column': [6, 7, 2, 3, 6, 2]}

df = pd.DataFrame(data=data)
df
| x_column | y_column | |
|---|---|---|
| 0 | 1 | 6 |
| 1 | 2 | 7 |
| 2 | 9 | 2 |
| 3 | 4 | 3 |
| 4 | 5 | 6 |
| 5 | 8 | 2 |
source_df = ColumnDataSource(df)

p = figure(plot_width=300, plot_height=300)
p.circle(x='x_column', y='y_column', source=source_df, size=15)
show(p)
图示如下:
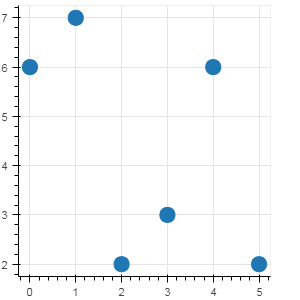
source_df = ColumnDataSource(df)

p = figure(plot_width=300, plot_height=300)

# 使用 “index” 作为 DataFrame 的默认索引名称
p.circle(x= 'index', y='y_column', source=source_df, size=15)
show(p)
图示如下:
ColumnDataSource (简称为 CDS) 的 data 参数,还也可以是 pandas 的 DataFrame 的 groupby 对象。
当CDS的参数是 DataFrame 的 groupby 对象时,在绘图时使用的 列名为 groupby 对象的 groupby.describe() 方法中的 列名称。
由于 groupby 会有多个统计参数,在引用时, 列表会合并到一起,形式如: column_mean 等。
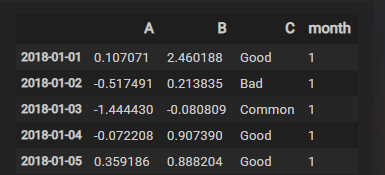
dates = pd.date_range('20180101', periods=360)

df = pd.DataFrame(np.random.randn(360,2), index=dates, columns=list('AB'))

df['C'] = ['Good', 'Bad', 'Common', 'Good','Good']*72
df['month'] = df.index.month

df
图示如下:
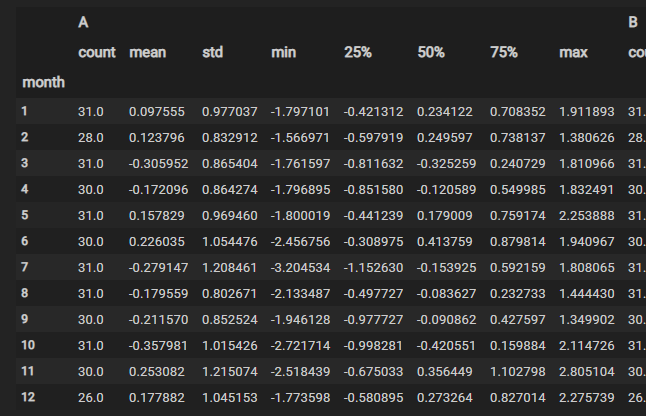
g = df.groupby('month')

g.describe()
图示如下:
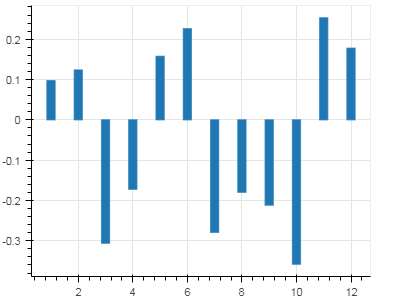
source_g = ColumnDataSource(g)
p = figure(plot_width=400, plot_height=300)
p.vbar(x='month', width=0.3, bottom=0, top='A_mean',source=source_g)
show(p)
图示如下:
相对于 matplotlib, pandas,seaborn 等 Python 会图库, Bokeh 提供了特有的数据源,掌握好 ColumnDataSource 的应用,对于 Bokeh 绘图是至关重要的。 后续,我们还会陆续接触到 ColumnDataSource 的相关用法。
对我的文章感兴趣的朋友,可以关注我的微信公众号「Python数据之道」(ID:PyDataLab),接收我的更新通知。