Bokeh 小册子: 29种Bokeh基础可视化图形
阅读量:次 Authors: 阳哥 PYTHONVISUALIZATION
Bokeh
阅读量:次 Authors: 阳哥 PYTHONVISUALIZATION
Bokeh
Table of Contents
前面,我们分享了关于 bokeh 入门 和 figure 使用的内容。今天,我们在前文的基础上,主要来分享29种基本的图形绘制方法,很多复杂的图形,都是基于这些基础图形的组合,所以,这些基础图形是我们进阶路上的必由之路。
下面,我们一起来看看都有哪些基础图形吧。
本次运行环境为:
本文主要来介绍 29 种基础图形的绘制用法。
首先,加载bokeh库,以及准备基础数据
from bokeh.plotting import figure, output_notebook, show
from bokeh.layouts import gridplot
import numpy as np

output_notebook()

np.random.seed(15)

x=np.random.randint(1,20,size=6)
y=np.random.randint(20,50,size=6)

print(x)
print(y)
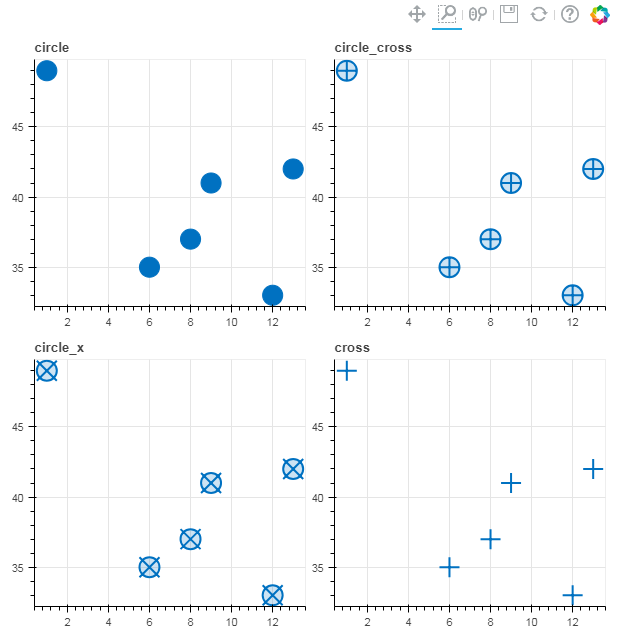
首先,我们来看看一组关于圆形及其相关的图形
p1 = figure(title='circle')
p1.circle(x,y,size=20, color='#0071c1')

p2 = figure(title='circle_cross')
p2.circle_cross(x,y,size=20, color='#0071c1',fill_alpha=0.2, line_width=2)

p3 = figure(title='circle_x')
p3.circle_x(x,y,size=20, color='#0071c1',fill_alpha=0.2, line_width=2)

p4 = figure(title='cross')
p4.cross(x,y,size=20, color='#0071c1', line_width=2)

grid=gridplot([p1,p2,p3,p4],ncols=2, plot_width=300,plot_height=300)

show(grid)
图示如下:
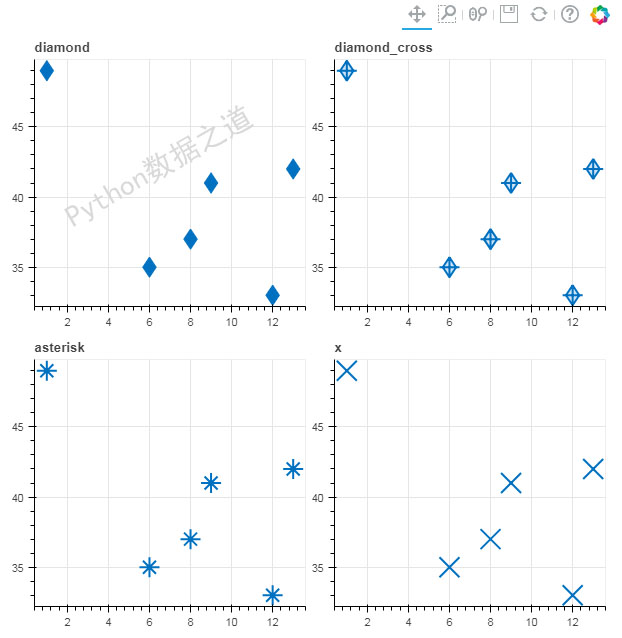
这是一组跟钻石还有星型符号相关的图形绘制,如下:
p1 = figure(title='diamond')
p1.diamond(x,y,size=20, color='#0071c1')

p2 = figure(title='diamond_cross')
p2.diamond_cross(x,y,size=20, color='#0071c1',fill_alpha=0.2, line_width=2)

p3 = figure(title='asterisk')
p3.asterisk(x,y,size=20, color='#0071c1',fill_alpha=0.2, line_width=2)

p4 = figure(title='x')
p4.x(x,y,size=20, color='#0071c1', line_width=2)


grid=gridplot([p1,p2,p3,p4],ncols=2, plot_width=300,plot_height=300)

show(grid)
图示如下:
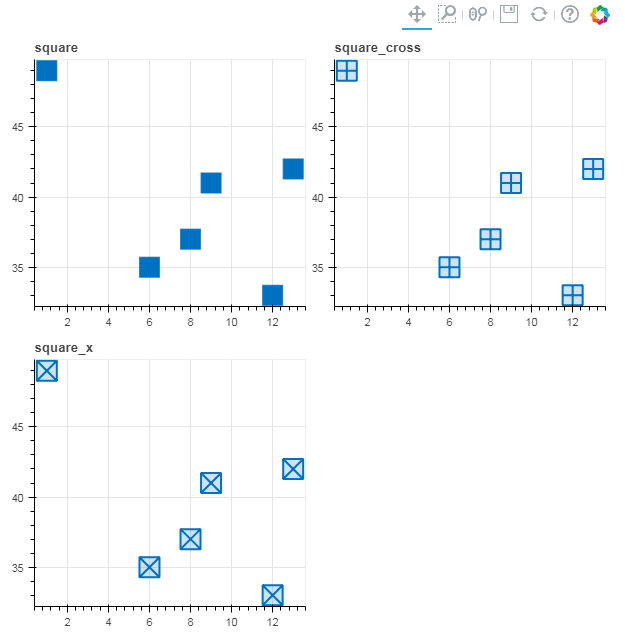
这里,还有跟方块相关的一组图形
p1 = figure(title='square')
p1.square(x,y,size=20, color='#0071c1')

p2 = figure(title='square_cross')
p2.square_cross(x,y,size=20, color='#0071c1',fill_alpha=0.2, line_width=2)

p3 = figure(title='square_x')
p3.square_x(x,y,size=20, color='#0071c1',fill_alpha=0.2, line_width=2)


grid=gridplot([p1,p2,p3],ncols=2, plot_width=300,plot_height=300)

show(grid)
图示如下:
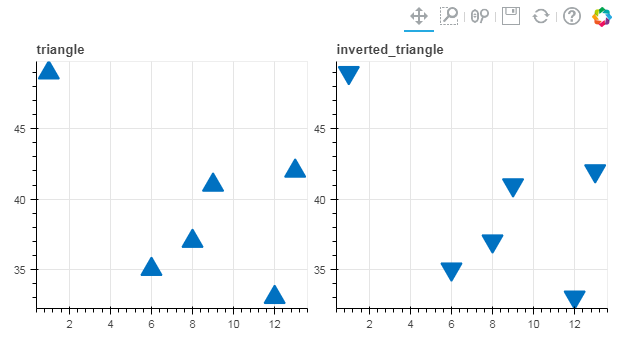
接下来,是三角形的绘制
p3 = figure(title='triangle')
p3.triangle(x,y,size=20, color='#0071c1', line_width=2)

p4 = figure(title='inverted_triangle')
p4.inverted_triangle(x,y,size=20, color='#0071c1', line_width=2)

grid=gridplot([p3,p4],ncols=2, plot_width=300,plot_height=300)

show(grid)
图示如下:
p1 = figure(title='annulus')
p1.annulus(x,y,color='#0071c1', inner_radius=0.8, outer_radius=1.2)

p2 = figure(title='wedge')
p2.wedge(x,y,color='#0071c1', radius=0.8, start_angle=0.5, end_angle=4.5, direction='anticlock')

p3 = figure(title='ellipse')
p3.ellipse(x,y,color='#0071c1', width=2, height=3.6, angle=30)

p4 = figure(title='oval')
p4.oval(x,y,color='#0071c1', width=2, height=3.6, angle=30)


grid=gridplot([p1,p2,p3,p4],ncols=2, plot_width=300,plot_height=300)

show(grid)
图示如下:
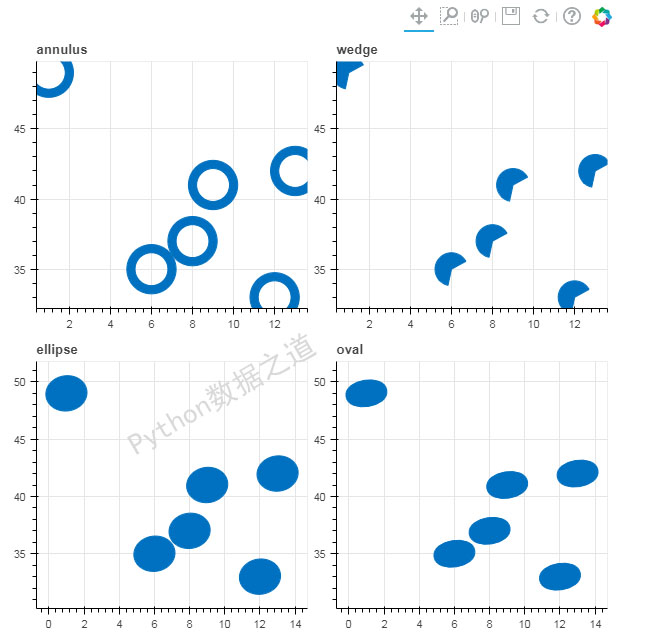
从上图来看,同样的数据源,ellipse 和 oval 绘制出来的椭圆形状,看起来是有些差异的。有兴趣的同学可以研究下其中的原因。
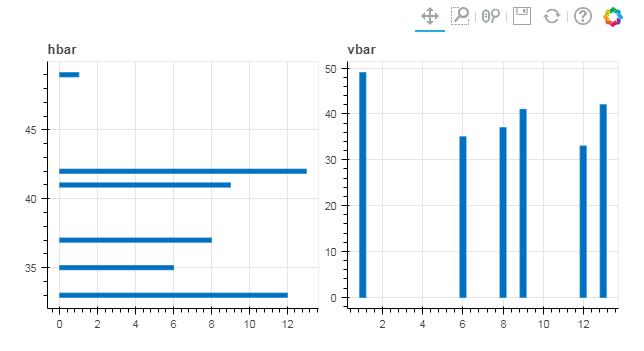
绘制柱状图,分为水平柱状图和垂直柱状图,这个也是平时我们用的比较多的类型之一。
p2 = figure(title='hbar')
p2.hbar(y=y, height=0.3, left=0, right=x, color='#0071c1')

p3 = figure(title='vbar')
p3.vbar(x=x, width=0.3, bottom=0, top=y, color='#0071c1')

grid=gridplot([p2,p3],ncols=2, plot_width=300,plot_height=300)

show(grid)
图示如下:
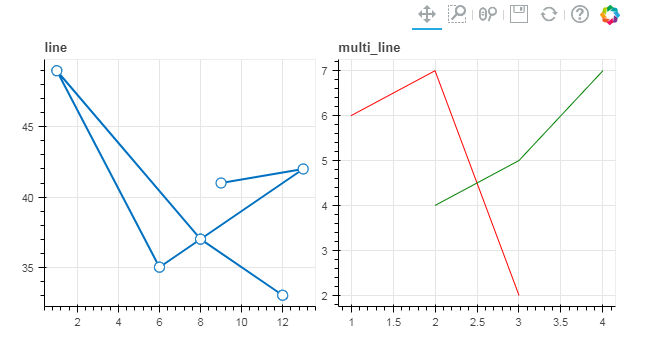
线状图或者称为折线图,单独只绘制线条时,可能视觉效果没有那么好看,有时候会配合圆形、方形等上面描述过的图形一起使用。
p1 = figure(title='line')
p1.line(x,y,color='#0071c1', line_width=2)
p1.circle(x,y,size=10,color='#0071c1',fill_color='white')

from bokeh.plotting import figure, output_file, show

p2 = figure(title='multi_line')
p2.multi_line(xs=[[1, 2, 3], [2, 3, 4]], ys=[[6, 7, 2], [4, 5, 7]],
             color=['red','green'])

grid=gridplot([p1,p2],ncols=2, plot_width=300,plot_height=300)

show(grid)
图示如下:
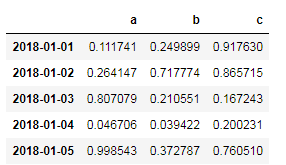
来看看关于 multi_line 的一个稍微复杂一些的例子,如下
from bokeh.palettes import Spectral11
import pandas as pd

df = pd.DataFrame(data=np.random.rand(5,3), columns = ('a', 'b' ,'c'),
                  index = pd.DatetimeIndex(start='01-01-2018',periods=5, freq='d'))

df
numlines=len(df.columns)
mypalette=Spectral11[0:numlines]

p = figure(width=500, height=300, x_axis_type="datetime")
p.multi_line(xs=[df.index.values]*numlines,
                ys=[df[name].values for name in df],
                line_color=mypalette,
                line_width=2)
show(p)
图示如下:
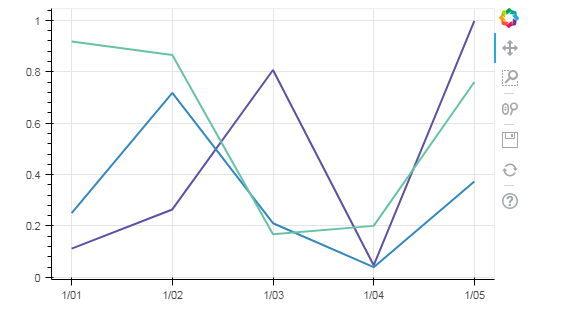
关于这个 multi_line, 总觉得在 bokeh 里过于复杂, 在 pandas 里绘制类似的图形,相对来说比较容易。
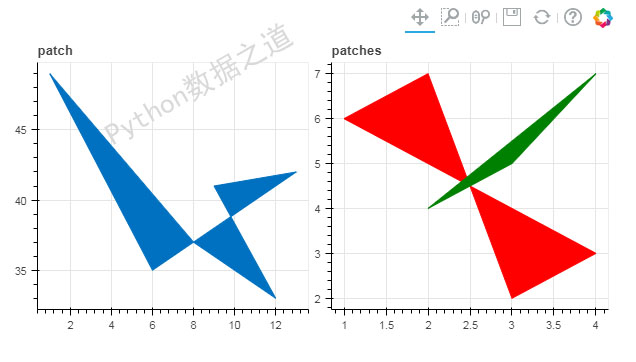
patch/patches, 中文翻译不确定如何解释为好,这里姑且称之为 “块状图” 吧。
p1 = figure(title='patch')
p1.patch(x,y,color='#0071c1')


p2 = figure(title='patches')
p2.patches(xs=[[1, 2, 3, 4], [2, 3, 4]], ys=[[6, 7, 2, 3], [4, 5, 7]],
             color=['red','green'])

grid=gridplot([p1,p2],ncols=2, plot_width=300,plot_height=300)

show(grid)
图示如下:
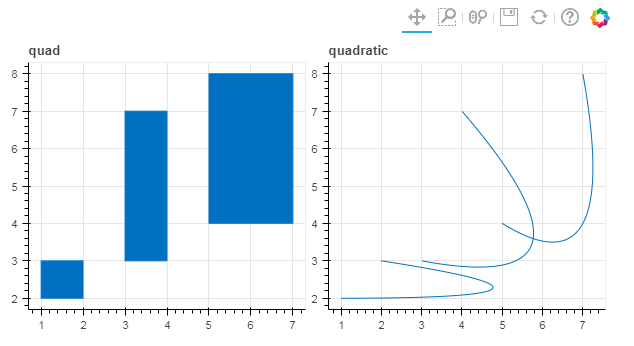
p1 = figure(title='quad')
p1.quad(left=[1,3,5],right=[2,4,7], top=[3,7,8], bottom=[2,3,4], color='#0071c1')


p2 = figure(title='quadratic')
p2.quadratic(x0=[1,3,5],x1=[2,4,7], y1=[3,7,8], y0=[2,3,4], cx=8 , cy=2, color='#0071c1')

grid=gridplot([p1,p2],ncols=2, plot_width=300,plot_height=300)

show(grid)
图示如下:
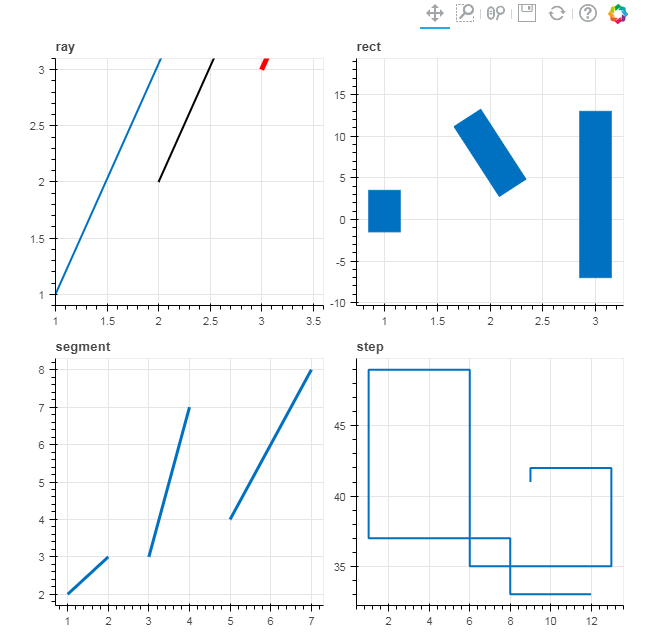
p1 = figure(title='ray', x_range=[1,3.6])
p1.ray(x=[1, 2, 3], y=[1, 2, 3], length=45, angle=20, color=["#0071c1", 'black', 'red'],
         line_width=[2,2,5])

p2 = figure(title='rect')
p2.rect(x=[1, 2, 3], y=[1, 8, 3], width=0.3, height=[5,10,20],angle=[0,10,0], color="#0071c1")

p3= figure(title='segment')
p3.segment(x0=[1,3,5],x1=[2,4,7], y1=[3,7,8], y0=[2,3,4], color='#0071c1', line_width=3)

p4 = figure(title='step')
p4.step(x, y, color="#0071c1",line_width=2)

grid=gridplot([p1,p2,p3,p4],ncols=2, plot_width=300,plot_height=300)

show(grid)
图示如下:
这 29 种图形,是 bokeh 中比较基础的类型,其中一部分,我们会在后续分享中多次应用,希望对大家有所启发。
当然,还有一些图形没有提到,各位可以自行研究下。
对我的文章感兴趣的朋友,可以关注我的微信公众号「Python数据之道」(ID:PyDataLab),接收我的更新通知。